
Australia’s road toll continues to climb despite the proliferation of ever-safer new cars, with pedestrian deaths in particular an area of concern.
Government data shows the death toll on Australia’s roads during March 2023 was 107 people, while the 12-month period ending in March 2023 saw 1204 road deaths.
Those figures mean increases of 2.3 per cent and 5.9 per cent respectively over the corresponding periods in the previous year/s, within the latter figure equating to 67 more people killed.
All age groups (from 8-16 all the way through to over 75 years) experienced percentage increases, as did both males (3.8 per cent to 885 deaths) and females (12.8 per cent to 318 deaths).
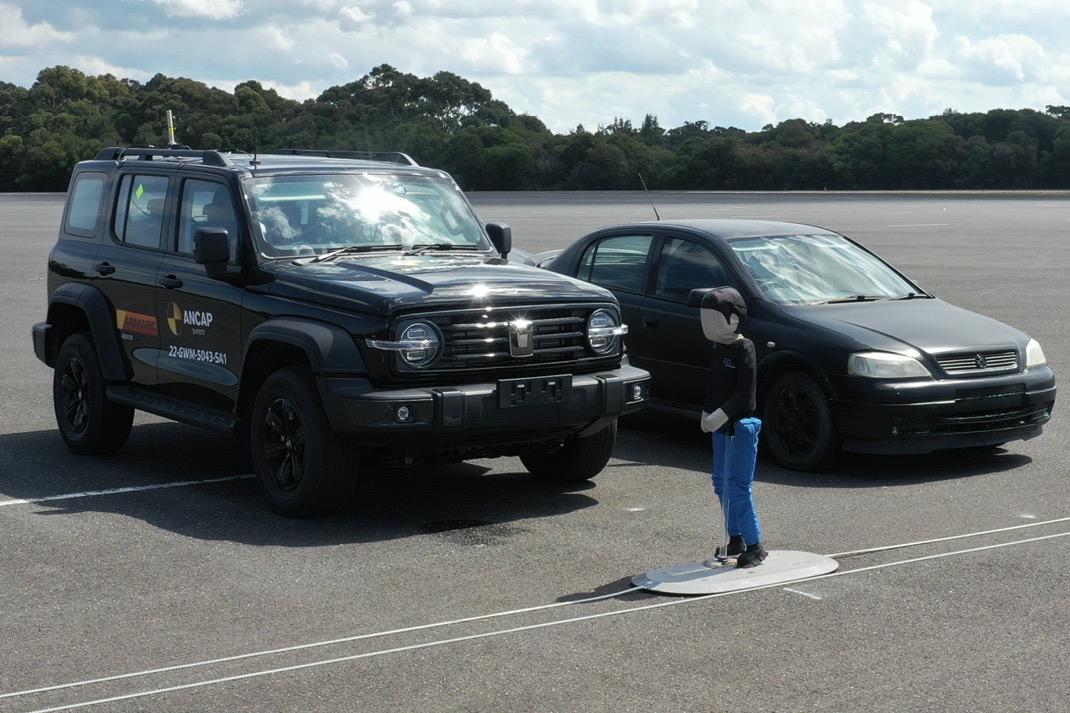
While increases in road deaths were tracked across various road user groups, there was a particularly alarming spike in pedestrian deaths – which were up 22.6 per cent year-on-year.
While one might suspect this is due to the end of lockdowns, the latest pedestrian death tally is higher than the period immediately preceding COVID (163 versus 159).
This development once again prompted the Australian Automobile Association (AAA) to demand more detailed public data on road trauma, to help make policy that addresses the worrying trend.
The AAA is the peak body for the State-based motoring clubs such as the NRMA and RACV.
“Deaths are still rising, but we still have no national data on crash causes, serious injuries, road quality, or details on the people and vehicles involved,” said AAA managing director Michael Bradley.
“We know that pedestrian road deaths rose by 22.6 per cent in the 12 months to 31 March. But we don’t know the reasons for this surge.”
As we’ve reported before, the AAA’s 2023-24 Budget submission urges the Australian Government to make federal road funding to states and territories contingent on “greater transparency of state-held road crash data”.
We have road deaths by vehicle type, gender, age and region, but there’s much more detailed information out there that could help tailor policy, the AAA contends.
“This would enable motorists and taxpayers to judge what’s going wrong, and would guide effective road safety measures,” Mr Bradley said.
“It makes no sense for governments to set targets on road safety without releasing relevant data about what’s working and what’s failing.”
While new cars are getting ever-safer, more people are dying on local roads. The 2018 calendar-year road toll was 1135 people, while it climbed to 1192 in 2022. The death figures over quarter-one of 2023 are 4 per cent higher again.
It’s much worse in the regions than the cities. Australians in sparsely populated regional areas are about five times more likely to die in road crashes than those in urban areas, according to the peak body for Australia’s state-based motoring clubs.
Contemporary data from the Bureau of Infrastructure and Transport Research Economics found the per-capita road death rate for regional Australians in 2022 was 10.6 deaths per 100,000 people, while the corresponding rate for urban Australians was 2.24 deaths per 100,000 people.
Beyond calling for greater data transparency, the AAA also demands road funding reform, principally ensuring every cent of fuel excise revenue go back into roads.
According to its research, only 54 per cent of the excise has been re-invested in land transport projects over the past decade.
Road deaths by regions April 1 2022 to March 31 2023, compared to same period in previous years:
| Jurisdiction | April 2022-March 2023 | Increase YoY % |
|---|---|---|
| NSW | 289 | 0.0% |
| QLD | 281 | Up 1.8% |
| VIC | 259 | Up 9.7% |
| WA | 180 | Up 16.9 |
| SA | 93 | Up 9.4% |
| TAS | 48 | Up 9.1% |
| NT | 37 | Down 14.0% |
| ACT | 17 | Up 70.0% |
Road deaths by road user type April 1 2022 to March 31 2023, compared to same period in previous years:
| Road user group | April 2022-March 2023 | Increase YoY % |
|---|---|---|
| Driver | 557 | Up 2.2% |
| Passenger | 189 | Up 3.8% |
| Pedestrian | 163 | Up 22.6% |
| Motorcyclist | 246 | Up 7.0% |
| Cyclist | 40 | Up 2.6% |