
We live in times where fuel efficiency and affordability are growing priorities. The former due to climate change and the latter to a shaky economic situation.
Yet demand for the market’s cheapest and smallest cars has collapsed over the past decade, as buyers flock to higher-riding SUVs.
This in turn has seen brands discontinue their smallest and cheapest cars at a rate of knots, with the number of Micro and Light cars on sale dropping from 38 models in 2013 to 16 at the end of 2022.

Accordingly, this lack of maximally affordable used cars has undoubtedly put upward price pressures on used cars, as buyers on a budget opt for pre-owned.
We’ve gone through the sales figures from 2013 to now, and mapped the changes in the Micro and Light Car classes, as defined by industry stats database VFACTS.
We’ve bundled these two classes together because, frankly, to an average customer they amount to pretty much the same thing. A Kia Picanto (Micro) and Toyota Yaris (Light) are hardly different from one another.
As the table shows, in 2013 Micro and Light Cars accounted for 136,300 sales, equivalent to a 12 per cent overall share of the Australian new car market.
Sales and market share have steadily declined in mostly linear fashion ever since, hitting their absolute low at the height of COVID (less than a third of the 2013 tally).
Even with the small rally since then taken into account, at the end of 2022 the sales and market share of Micro and Light Cars were barely a third of the 2013 tally.

One key reason for this beyond changing consumer sentiment – and until recently low interest rates – has been the push for car brands to fit more and more driver-assist and luxury features into even the cheapest cars, thereby driving up the price at a greater rate than wage growth.
Because these segments are so cost-sensitive, that hurts. It also means buyers might just bite the bullet and buy that bigger vehicle because the cost difference over a payment period really isn’t all that great.
Correlation and causation aren’t always aligned, but consider: In 2013 the Small SUV segment had 6.6 per cent market share, from a list of 20 models. By 2022 this market (now divided into Light SUV and Small SUV) accounted for 18.2 per cent share, from a total of 44 models.
So in the timeframe where Micro/Light Car share plummeted to a third of their original size, the market share of Light/Small SUVs tripled, and the choice of models more than doubled.
Top-selling Micro Cars 2013-22
- Kia Picanto: 31,566 (2016-22)
- Mitsubishi Mirage: 29,740 (2013-22)
- Fiat 500: 12,705 (2013-22)
- Nissan Micra: 9513 (2013-17)
- Holden Spark: 8203 (2013-19)
Top-selling Light Cars 2013-22
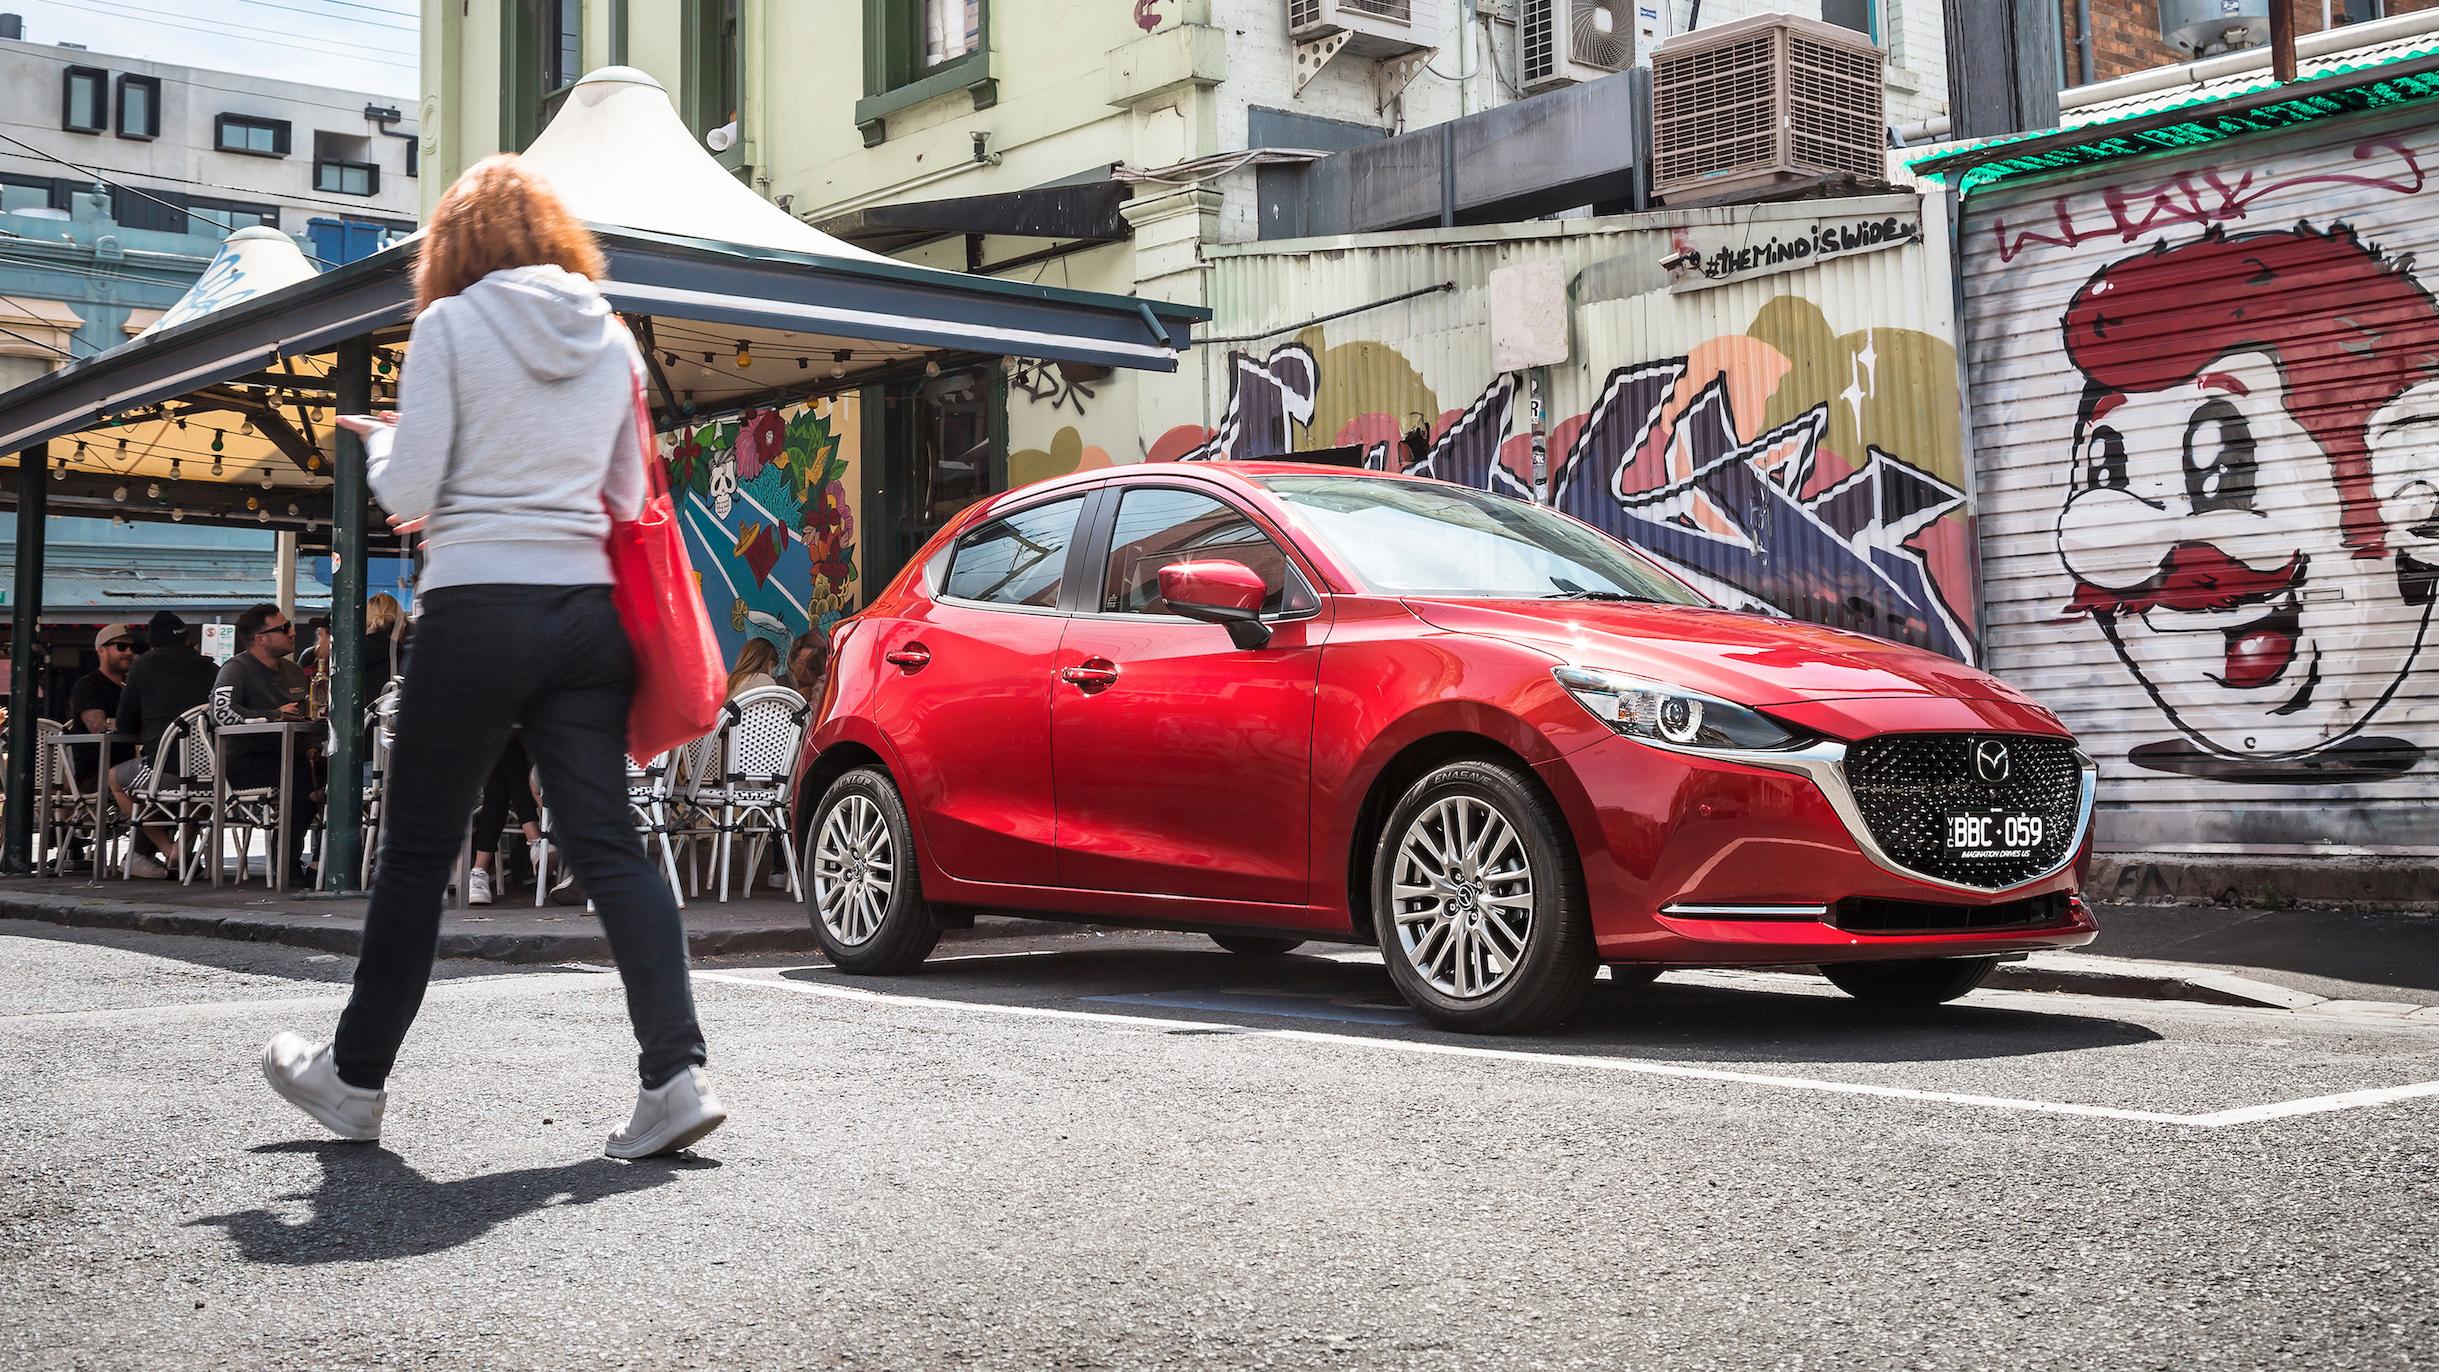
- Mazda 2: 102,589 (2013-22)
- Toyota Yaris: 95,298 (2013-22)
- Hyundai Accent: 86,390 (2013-20)
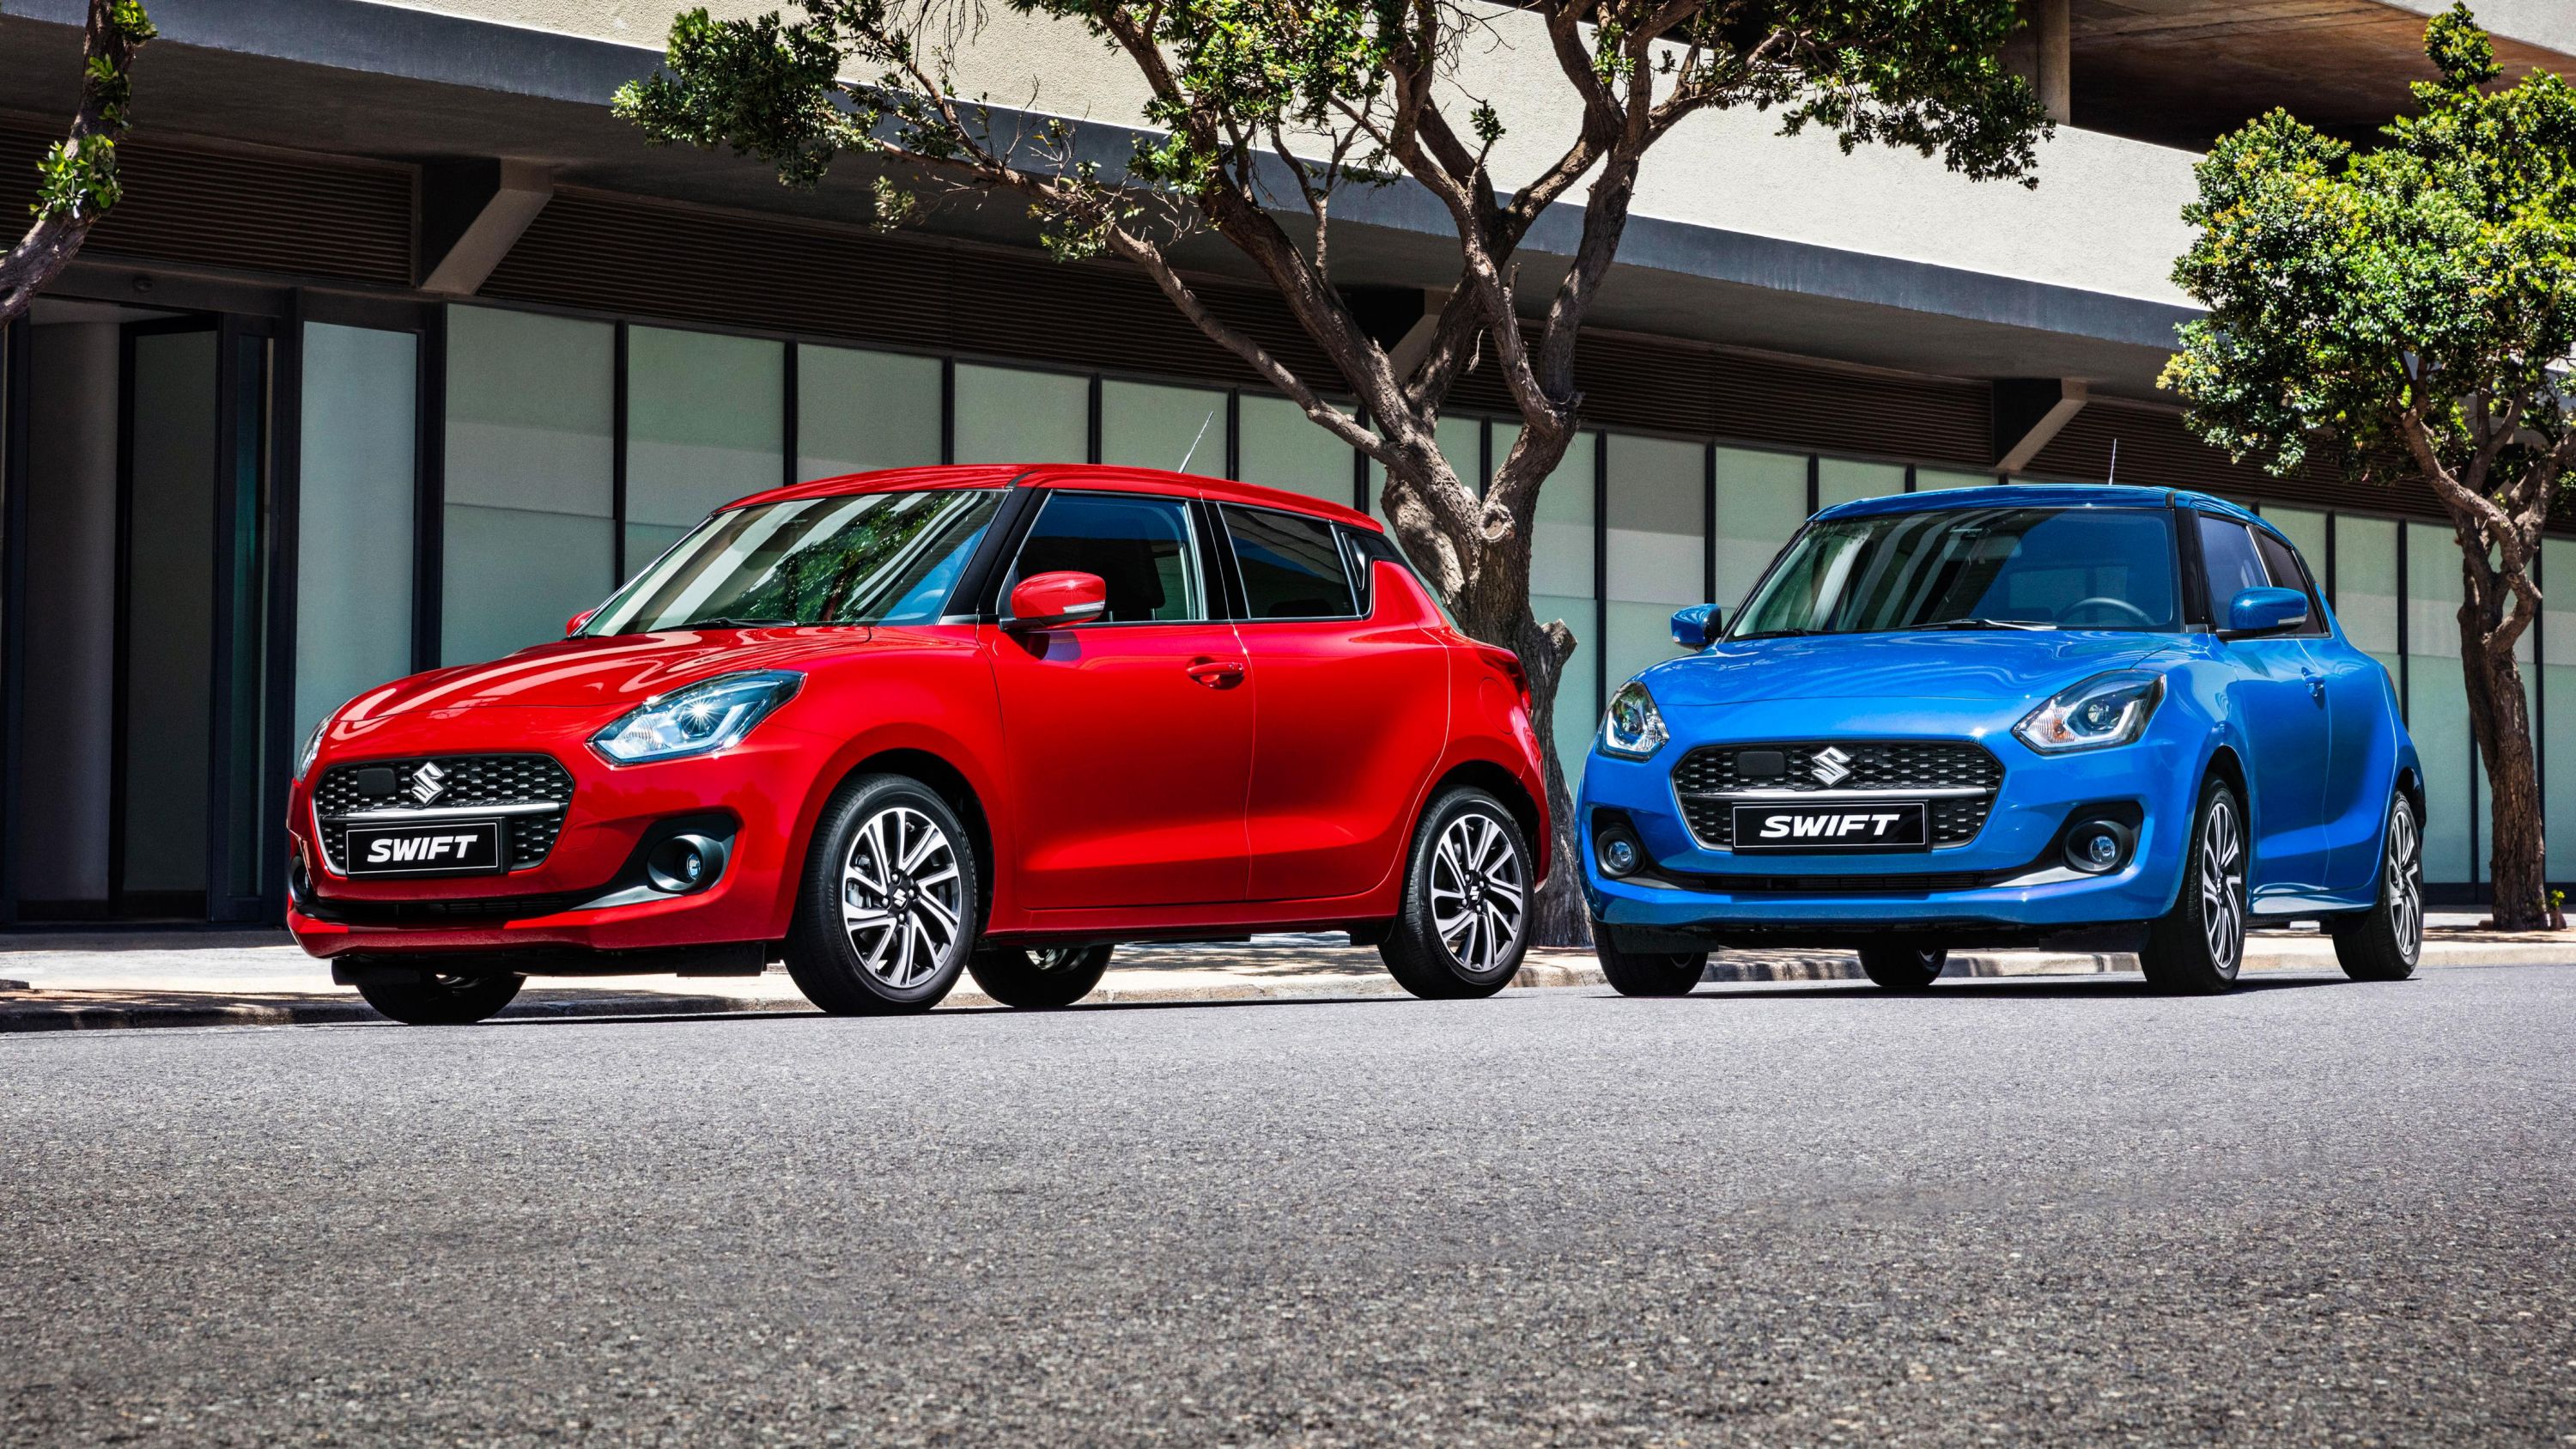
- Suzuki Swift: 74,305 (2013-22)
- Kia Rio: 67,256 (2013-22)
- Volkswagen Polo: 59,174 (2013-22)
- Honda Jazz: 55,028 (2013-21)
- MG 3: 41,733 (2017-22)
- Holden Barina: 40,034 (2013-19)
- Hyundai i20: 39,865 (2013-15, 2021-22)
Micro and Light Car sales – a decade of decline
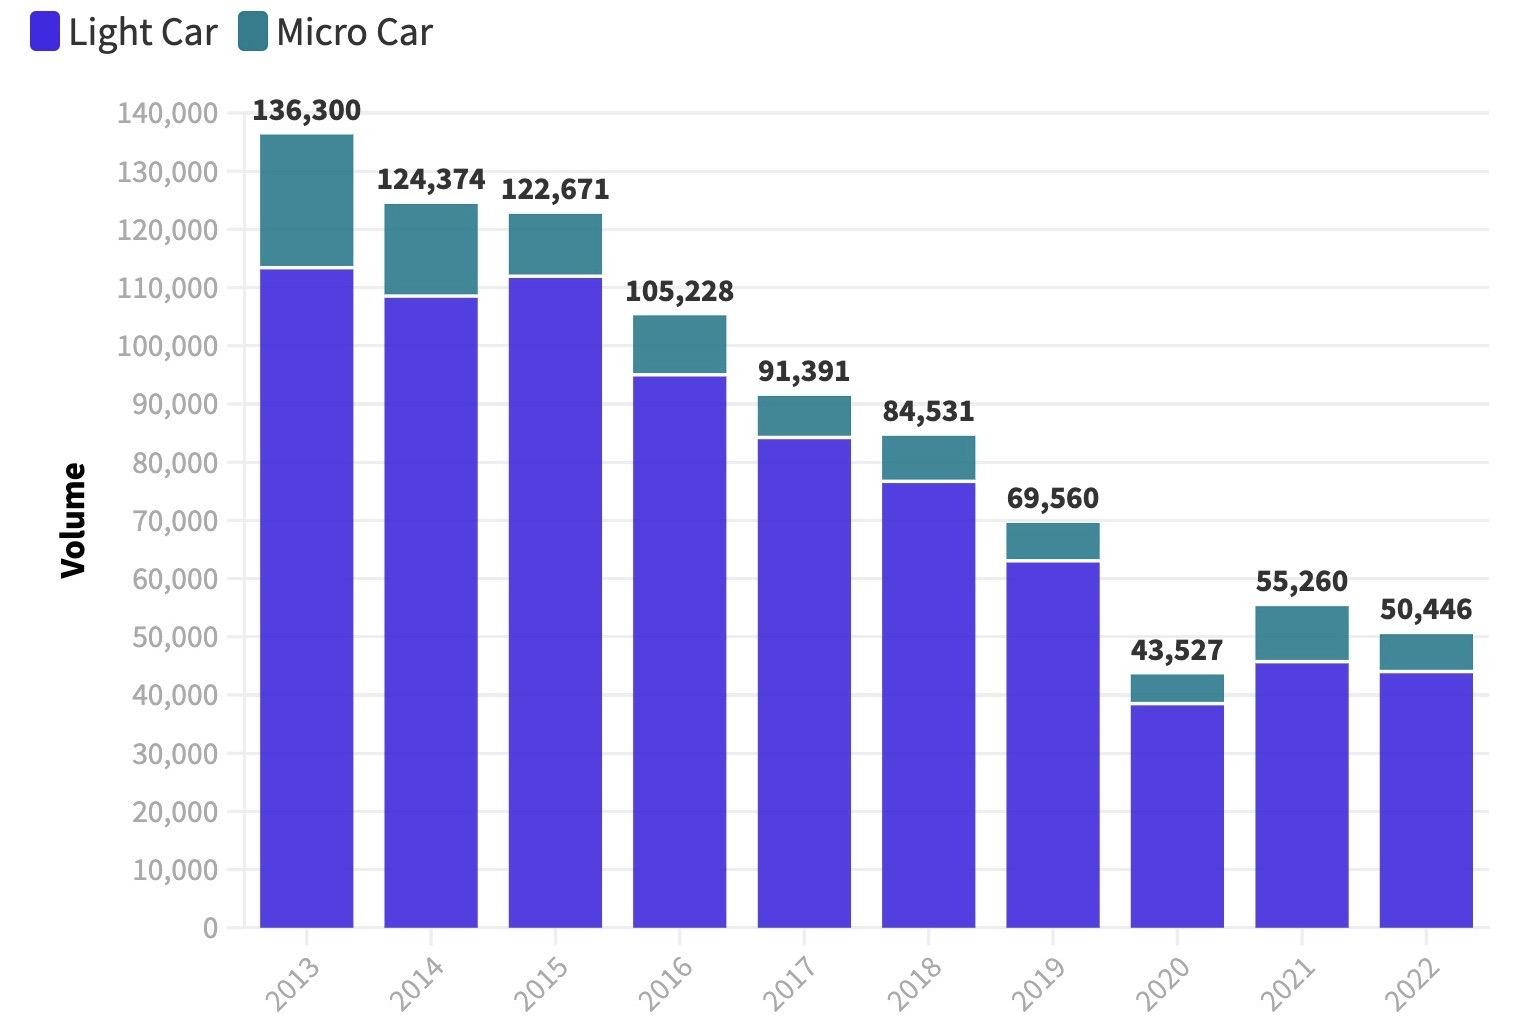
Micro and Light car sales, share and choice tracked
| Year | Sales | Share % | Models |
|---|---|---|---|
| 2022 | 50,446 | 4.7 | 16 |
| 2021 | 55,260 | 5.3 | 19 |
| 2020 | 43,527 | 4.7 | 21 |
| 2019 | 69,560 | 6.5 | 24 |
| 2018 | 84,531 | 7.4 | 27 |
| 2017 | 91,391 | 7.7 | 29 |
| 2016 | 105,228 | 9 | 29 |
| 2015 | 122,671 | 10.6 | 35 |
| 2014 | 124,374 | 11.2 | 39 |
| 2013 | 136,300 | 12.0 | 38 |