The market share of cars sourced from Japan is on track to be the lowest in decades this year, driven by Toyota’s supply shortages and correlating with rapid growth in imports from China.
In the last 19 years the average yearly market share of Japanese-made cars in Australia has been 32.7 per cent, with the lowest figure since our records began being 27.6 per cent in 2016, and the greatest being 38.3 per cent in 2005.
So far in 2023 though, Japan-made cars account for 27.3 per cent of all sales, with 124,535 units out of a market-wide 456,833 sourced from the Land of the Rising Sun.
While this means the country is still Australia’s biggest source of vehicle imports ahead of Thailand, the market share figure is at its lowest since at least 2005 – which is as far back as our database goes.
To put this market share information into some perspective, consider Australians took delivery of nearly 22,000 (21,896) more Japan-made cars in the first five months of 2022 than they did over the same period of time in 2023.
In other words, a few percentage points of market share equals tens of thousands of cars, as the table below hopefully demonstrates.
| Calendar Year | Made in Japan | Total market | % from Japan |
|---|---|---|---|
| 2023 (YTD) | 124,535 | 456,833 | 27.3% |
| 2022 | 330,061 | 1,081,429 | 30.5% |
| 2021 | 350,934 | 1,049,831 | 33.4% |
| 2020 | 309,601 | 916,968 | 33.8% |
| 2019 | 334,075 | 1,062,867 | 31.4% |
| 2018 | 356,230 | 1,153,111 | 30.9% |
| 2017 | 341,663 | 1,189,116 | 28.7% |
| 2016 | 325,689 | 1,178,133 | 27.6% |
| 2015 | 335,288 | 1,155,408 | 29.0% |
| 2014 | 329,009 | 1,113,224 | 29.6% |
| 2013 | 362,058 | 1,136,227 | 31.9% |
| 2012 | 390,289 | 1,112,032 | 35.1% |
| 2011 | 331,904 | 1,008,437 | 32.9% |
| 2010 | 356,968 | 1,035,574 | 34.5% |
| 2009 | 334,655 | 937,328 | 35.7% |
| 2008 | 378,992 | 1,012,164 | 37.4% |
| 2007 | 369,875 | 1,049,982 | 35.2% |
| 2006 | 367,443 | 962,666 | 38.2% |
| 2005 | 378,758 | 988,269 | 38.3% |
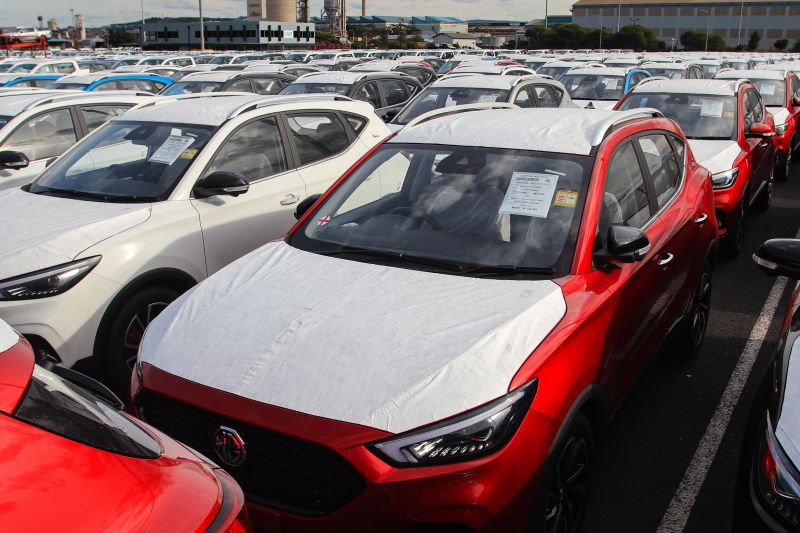
The drop off in sales of Japanese-made cars this year coincides with a spike in deliveries of cars made in China, which so far in 2023 sit at 72,619 units.
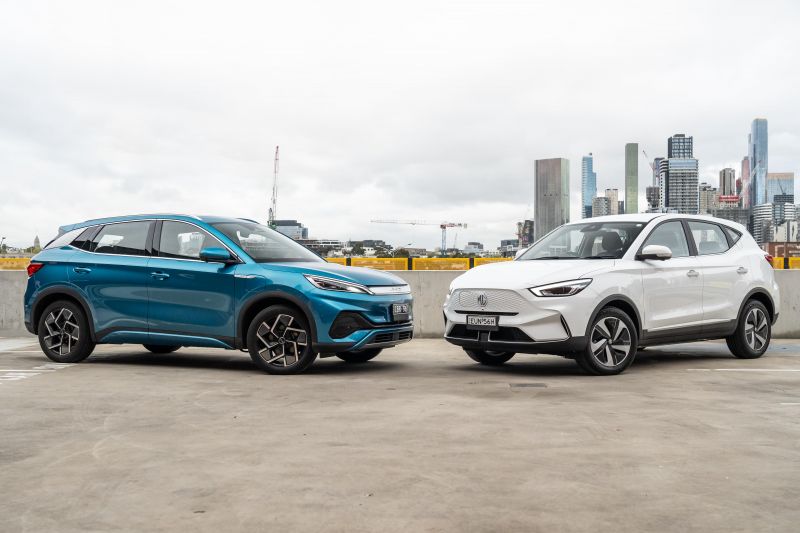
That’s up almost 80 per cent year-on-year, and equal to 15.9 per cent market share. Popular brands that source all their cars from China include MG (seventh overall), Tesla (eighth), GWM (13th), and LDV (16th).
It should be little surprise the five carmakers that have lost the most sales and share in 2023 year-on-year (YoY) are Japanese – though of course not all cars sold by Japanese brands are actually made in Japan. Our data above is specifically about cars made in Japan, for clarity.
Year to date 2023:
- Overall market – up 4.3 per cent or 18,949 units
- Toyota – down 27.9 per cent or 27,529 units
- Mitsubishi – down 28.5 per cent or 10,240 units
- Mazda – down 6.8 per cent or 2969 units
- Suzuki – down 17.8 per cent or 1551 units
- Honda – down 14.3 per cent or 943 units
Toyota has been hit harder by stock shortages than other brands simply by virtue of its sheer scale, with wait times of key models having stretched out past two years at times. Its YTD market share of 15.6 per cent is concerning, given it’s sat north of 20 per cent for years now.
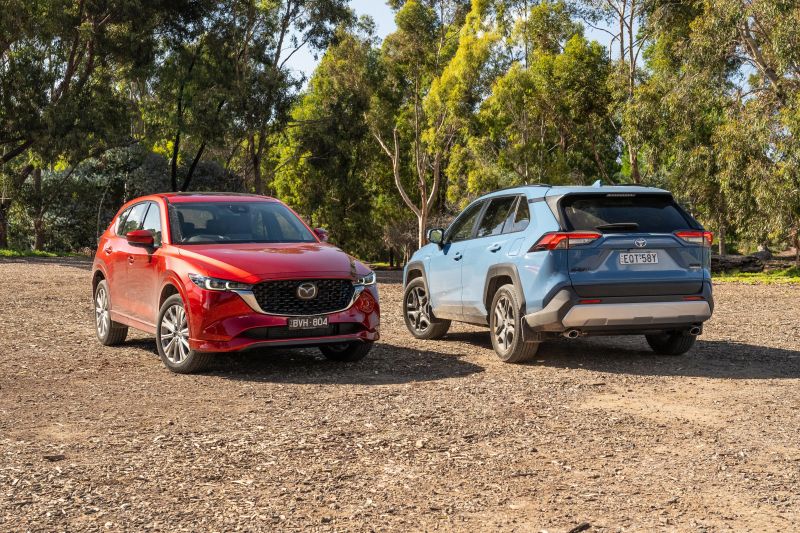
While not all Toyotas sold here come from Japan – the HiLux comes from Thailand for instance – its vehicles with the biggest drop-offs do.
These are namely the RAV4 (down 40 per cent), Prado (down 52.5 per cent), Corolla (down 47.8 per cent), C-HR (down 47.6 per cent) and Camry (down 38.1 per cent).
It’s a somewhat different story for Mitsubishi given the Triton and Pajero Sport – again, both made in Thailand – are responsible for that brand’s drop-off.
Year to date 2023, sales by countries of manufacture
- Japan – 124,535 units, down 15 per cent
- Thailand – 97,237 units, down 5.6 per cent
- China – 72,619, up 78.6 per cent
- Korea – 65,771, up 3.3 per cent
- Germany – 19,829, up 31.9 per cent
- Overall market – up 4.3 per cent
While not yet statistically all that significant, it’s highly possible more Australian private and fleet buyers will shun Japanese cars going forward given the lack of EVs coming from there.
EV sales in Australia sit at a record 32,050 units this year, up four-fold YoY and equal to 7.0 per cent market share.
Yet none of the top 10 come from Japan, with the top-sellers all coming from China, and to a lesser extent Korea and Germany.
Looking ahead at the carmaker’s launch calendars, it’s unlikely this scenario will change all that much in the immediate future, either.
MORE: EVs coming to Australia, launch calendar and what’s here already
MORE: Aussie car sales spike, best May result ever


